5.1.4. Overmodulation
Overmodulation is a method of increasing the output voltage capability of a motor drive using three-phase modulation. This is achieved by allowing distortion in the output voltages for modulation indices above 1.0. Benefits include a slight increase in potential speed range, as well as slightly faster current control capability because of the increased output voltage range.
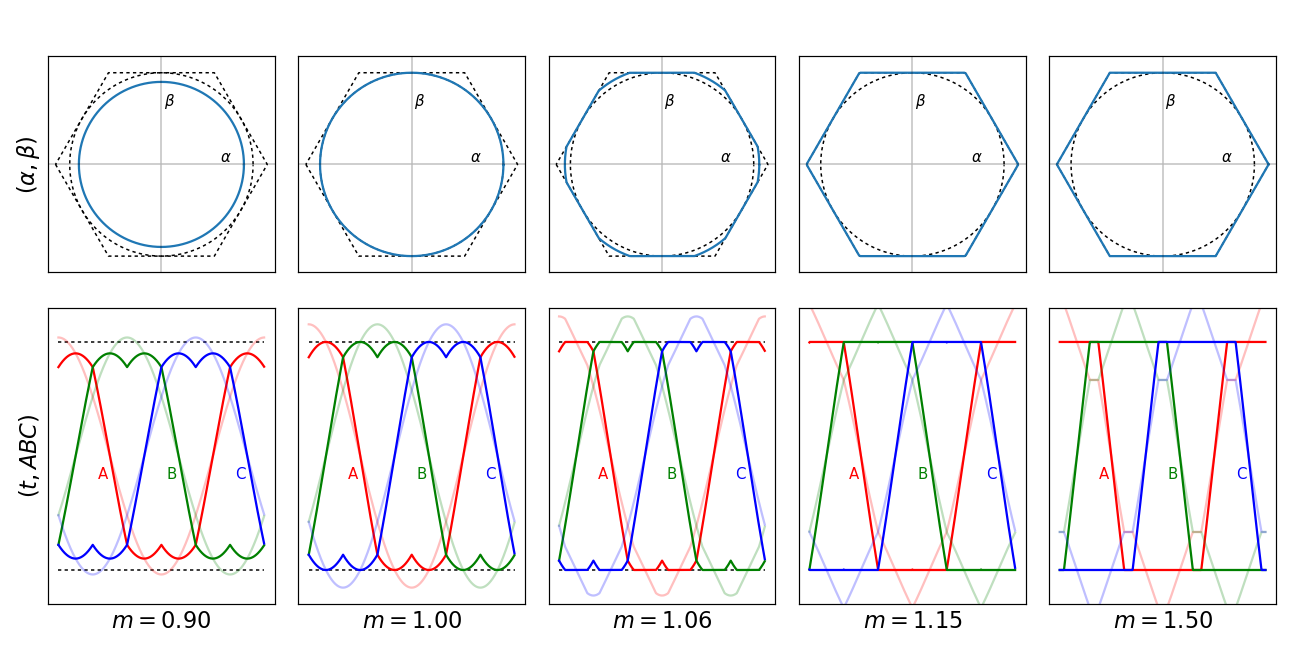
Figure 5.12 shows three-phase modulation waveforms for five increasing values of modulation index.

Figure 5.12 Overmodulation example — the upper row of subplots illustrates voltage trajectories in the stationary (\(\alpha\beta\)) reference frame, while the lower row illustrates voltage trajectories plotted vs. time. The dashed circle in the stationary frame represents a modulation index of 1.0 (maximum output voltage capability without distortion); the dashed hexagon in the stationary frame and dashed lines in the timeseries plots represent maximum voltage capability including distortion. Five different values of modulation index m are shown, one in each column. Line-to-neutral timeseries waveforms are shown in faint colors.
5.1.4.1. Modulation index
The modulation index represents output amplitudes normalized to the full voltage span. This is the DC link voltage, multiplied by the difference between the maximum and minimum allowable duty cycles applied to each half bridge; for example, in the following situation the full voltage span is 23 V = 25 V × (95% − 3%):
DC link voltage of 25 V
Dead time of 1% (for example 500 ns with a period of 50 μs)
Minimum half-bridge duty cycle of 3% (upper transistors at 2%, lower transistors at 96%)
Maximum half-bridge duty cycle of 95% (upper transistors at 94%, lower transistors at 4%)
This definition may be different in this context than in other situations. In this analysis of three-phase modulation, the modulation index represents voltages relative to the full voltage capability subject to duty cycle limitations.
A modulation index of 1.0 represents the maximum possible voltage amplitude for which a set of three-phase line-to-line sine waves can be achieved without distortion, and is shown in Figure 5.12 as the dotted circle. Output timeseries waveforms using zero-sequence modulation (aka space-vector modulation) below this point have a characteristic “double-humped” shape when shown as line-to-negative-link, but the line-to-line voltages are sinusoidal.
5.1.4.2. Overmodulation behavior in the stationary frame
Above a modulation index of 1.0, we must do something to limit the output waveforms on each phase within the range of allowable duty cycles. There are several methods of doing this:
The simplest is just to operate on each phase’s duty cycle individually, constraining within limits. This produces a realizable point in the \(\alpha\beta\) reference frame that is the closest distance to the ideal unconstrained value.
This clipping approaches a trapezoidal waveform when plotted as a timeseries; in the \(\alpha\beta\) reference frame, the voltage trajectory becomes “squished” against the hexagonal limit.
Another approach is to scale the three-phase set of duty cycles by some identical scaling factor \(K = \frac{1}{\max(1,D_{\mathrm{span}})}\), where \(D_{\mathrm{span}}\) is the difference between the highest and lowest duty cycle in the 3-phase set; \(K\) is 1.0 below overmodulation, and less than 1.0 when operating in overmodulation. In this case, the realizable and ideal points in the \(\alpha\beta\) reference frame maintain identical commutation angle. Drawbacks are that the computation is slightly more expensive (involving a divide), and less distortion is possible.
There is also an algorithmic approach described in an article by Peng et al called the method of realizable references. This has been applied to three-phase modulation in an article by Briz et al. It involves close coordination between the current controller and the saturation logic that restricts the output duty cycle.
The method of realizable references appears promising, but its complexity in both analysis and implementation precluded using it within the MCAF. The implementation used in the MCAF and shown in Figure 5.12 utilizes the simple per-phase clipping.
5.1.4.3. Overmodulation behavior in the synchronous frame
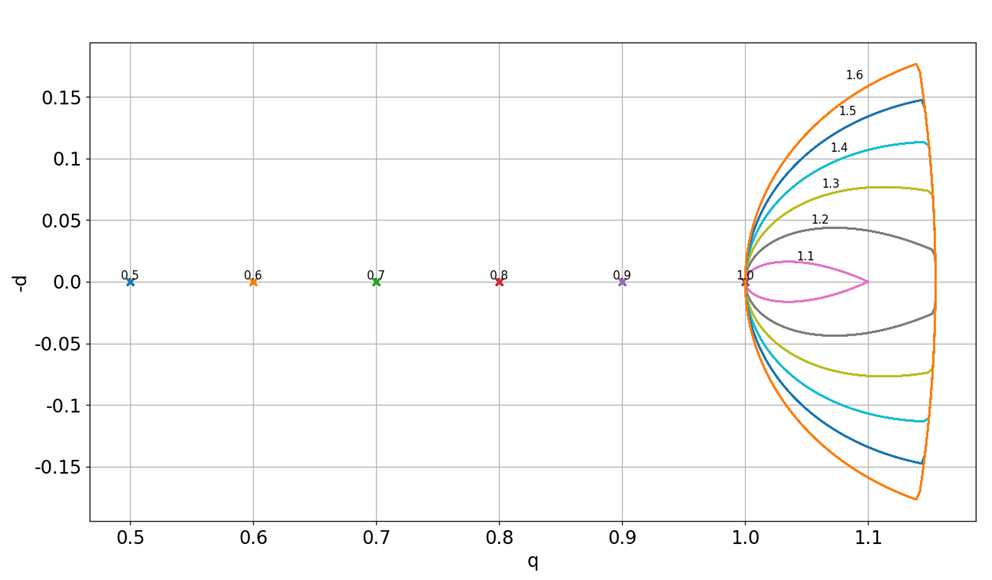
Figure 5.13 shows these voltage trajectories transformed into the synchronous (dq) reference frame. Below overmodulation, each is a single point: if we wanted some constant modulation index m, we can get exactly that. Upon entering overmodulation, the voltage trajectories no longer have constant values in the dq-frame. This represents voltage harmonics that appear as d- and q-axis distortion. These harmonics are at multiples of 6 times the electrical frequency; for example, if we are producing a 100Hz carrier frequency, then overmodulation harmonics appear at 600Hz, 1200Hz, 1800Hz, and so on. Because overmodulation is used primarily to run at higher speeds, where back-emf requirements are greater, these harmonics are usually above the current controller bandwidth, where the controller is not able to attenuate them, so they do appear in the current waveforms as well as voltage waveforms, although motor inductance usually keeps them at a fairly low level.

Figure 5.13 Synchronous frame behavior of overmodulation — trajectories plotted for increments of 0.1 in modulation index, and each is labeled with the corresponding modulation index. The d- and q-axes have been normalized so that 1.0 represents a modulation index of 1.0. Colors have no inherent significance other than to distinguish each of the trajectories.
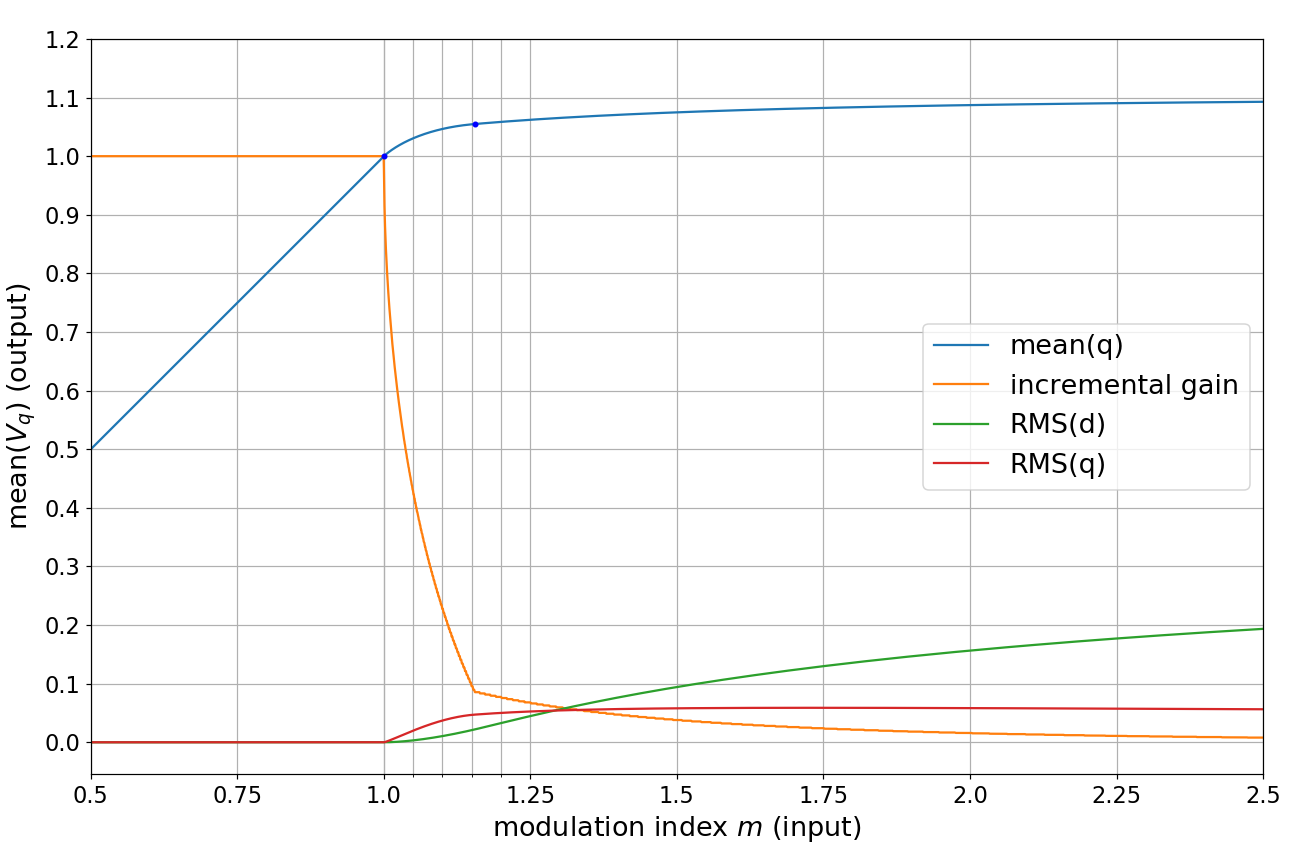
We can also gain some insight by graphing average behavior over a full commutation cycle as a function of modulation index, shown in Figure 5.14:

Figure 5.14 Metrics of overmodulation in the synchronous frame, as a function of modulation index — here we show the mean value of the resulting trajectory in the dq reference frame, as well as its incremental gain (\(\frac{\partial}{\partial m}\)), along with the root-mean-square (RMS) value of d- and q-axis voltage over the commutation cycle. This shows the magnitude of distortion along each axis, as a function of modulation index.
A few things to note here, as modulation index increases past 1.0:
The mean value of \(V_q\) is a nonlinear function of modulation index; it does increase beyond 1.0 (that’s the whole point of overmodulation) but it asymptotically approaches a maximum value of \(\frac{2}{\sqrt{3}}\cdot\frac{3}{\pi} = 2\sqrt{3}/\pi \approx 1.1027\)
(the factor of \(2/\sqrt{3}\) is the distance between the origin and each point of the hexagon, and the \(3/\pi\) factor represents the mean value of \(\cos\theta\) within the range \(\theta \in [-\frac{\pi}{6}, \frac{\pi}{6}]\))
The incremental gain quickly drops, from 1 at m = 1.0, down to below 0.1 at m = 1.15.
The d-axis distortion and q-axis distortion both asymptotically approach values that reflect the extreme case of six-step operation (with active switching on all three half-bridges; this is different than most implementations of six-step control that only operate two half-bridges at a time) where the trajectory forms a 60° arc in the d-q plane:
(5.19)¶\[\begin{aligned} V_{q,rms} &= \mathrm{RMS}\left(\tfrac{2}{\sqrt{3}}\cos \theta, -\tfrac{\pi}{6}, \tfrac{\pi}{6}\right) = \sqrt{\tfrac{2}{3} + \tfrac{\sqrt{3}}{\pi} - \tfrac{12}{\pi^2}} \approx 0.04627 \cr V_{d,rms} &= \mathrm{RMS}\left(\tfrac{2}{\sqrt{3}}\sin \theta, -\tfrac{\pi}{6}, \tfrac{\pi}{6}\right) = \sqrt{\tfrac{2}{3} - \tfrac{\sqrt{3}}{\pi}} \approx 0.33961 \end{aligned}\]The RMS q-axis distortion rises quickly, reaching approximately 0.0467 by \(m=1.15\), hitting a maximum of approximately 0.0588 near \(m=\sqrt{3} \approx 1.732\), and then decreasing asymptotically towards 0.04627 at very large modulation indices.
The RMS d-axis distortion rises slowly, reaching only approximately 0.0208 by \(m=1.15\).
All of these factors make overmodulation attractive at moderate modulation indices, but unattractive at extreme modulation indices. We can get that theoretical maximum voltage increase of 10.27%, but to do this requires extreme modulation indices, so in practical terms we are limited to somewhere around 3% – 7% “extra” voltage capability, by limiting the maximum modulation index to somewhere in the 1.05 – 1.25 range.
5.1.4.4. Coordinating overmodulation and controller limits
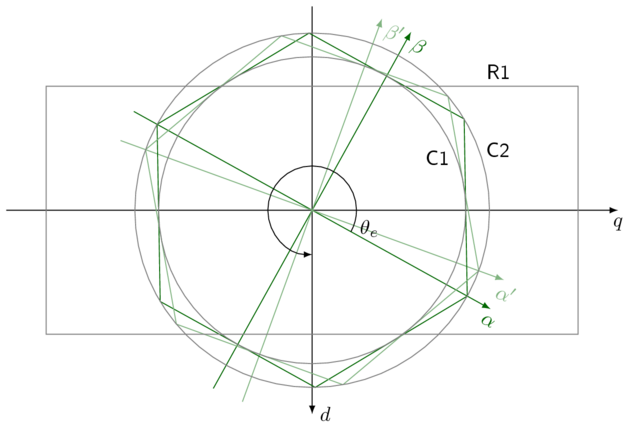
The nonlinear dependency of mean \(V_q\) on modulation index makes applying overmodulation to a vector current controller somewhat interesting. Figure 5.15 shows the limits in the dq frame attainable by overmodulation (essentially a hexagon rotating along with the commutation angle) and the limits applied by the MCAF current controller, namely a rectangular region with independent limits for each axis.

Figure 5.15 Interacting limits in overmodulation — the rectangle R1 in the dq frame represents the output voltage limits of the current controller. The hexagon rotates with commutation angle \(\theta_e\) and indicate physical limits attainable through three-phase modulation. Circle C1 represents a modulation index of 1, and circle C2 represents a modulation index of \(2/\sqrt{3}\) showing the outer locus of the hexagonal limit.
The selection of d- and q-axis controller limits is important; see the implementation notes below for particular recommendations. The “corner” operation (high values in both axes) is important; both axes are competing for voltage and the effective modulation index adds in quadrature. Operation in this corner is rare and usually confined to transients in the current controller. The reason for requiring more voltage along the q-axis is to accommodate the back-emf at high speeds; static values of d-axis voltage are required only by the inductive voltage drop \(\omega_eL_qI_q\) and a resistive voltage drop \(I_dR\) present only with non-zero d-axis current (used in flux weakening operation, or in maximum-torque-per-ampere control with salient-pole rotors — neither of which the MCAF supports at this time).
5.1.4.5. Implementation Notes
The MCAF implementation of the forward path (in Figure 4.2, the top row of blocks, including current controller, inverse Park and Clarke transforms, DC link voltage compensation, and zero-sequence modulation) relies only on the current controller and ZSM blocks to provide limiting and guard against overflow. As long as the current controller limits its outputs below a vector magnitude of \(V_{dc}\), subsequent blocks will not overflow. The output limits for each axis are a fixed constant for each axis (\(K_d\) and \(K_q\)) multiplied by the DC link voltage, so this means that \(K_d{}^2 + K_q{}^2 < 1\).
In the MCAF software, current controller voltages are expressed in terms of line-to-neutral
voltages, so a modulation index of 1.0 corresponds to a line-to-neutral voltage of
\(V_{dc}/\sqrt{3}\). If the d-axis and q-axis limits are expressed as modulation index limits
\(M_d\) and \(M_q\), then \(M_d = K_d \sqrt{3}\) and \(M_q = K_q \sqrt{3}\)
and the requirement is that \(M_d{}^2 + M_q{}^2 < 3\). The default values of these limits
in the MCAF is \(M_d = 1.0, M_q = 1.15\). (Software values are \(K_d = 0.57735, K_q = 0.66395\)
and appear as MCAF_CURRENT_CTRL_D_OUT_LIMIT and MCAF_CURRENT_CTRL_D_OUT_LIMIT in parameters/foc_params.h.)
We recommend a d-axis modulation index limit of 1.0, and a q-axis modulation index limit kept in the 1.05 – 1.25 range.
This leaves some design margin (\(1^2 + (1.25)^2 = 2.5625 < 3\)) and still provides significant
voltage capability through overmodulation.
5.1.4.5.1. Feature support
Overmodulation was not present in MCAF R1 but has been added in MCAF R2.
5.1.4.6. References
Youbin Peng, D. Vrancic and R. Hanus, “Anti-windup, bumpless, and conditioned transfer techniques for PID controllers”, IEEE Control Systems, vol. 16, no. 4, pp. 48-57, Aug 1996.
F. Briz, A. Diez, M. W. Degner and R. D. Lorenz, “Current and flux regulation in field-weakening operation”, IEEE Transactions on Industry Applications, vol. 37, no. 1, pp. 42-50, Jan/Feb 2001.
